Using prom-client to monitor threadfin-http application in docker swarm

Prometheus is probably one of the most popular monitoring tools for microservices architecture. With Prometheus, microservices environment like docker can be easily monitor by connecting Prometheus to docker swarm cluster and docker daemon. There are many articles available to talk about setting up Prometheus. The question I have is how about the microservice deployed in environment such docker swarm? how can we effectively monitor these applications?
I have recently found my answer through a npm library called prom-client ( https://www.npmjs.com/package/prom-client ). This is an amazing client library which allows me to connect my Node.JS application with Prometheus. To share this with you, I am going to take you through a demo by creating a 2 nodes docker swarm and deploy my threadfin-http as a docker service. On top of that, I also going to deploy prometheus and grafana to enable monitoring and dashboard for visualization.
Well… to kick start this, I am going to use threadfin-http (https://www.npmjs.com/package/threadfin-http) to create my Node.JS application. threadfin-http is an experimental Node.JS module I created several years ago. It has basic http function to serve static content as well as API implementation. API implementation will be dynamically mapped based on the request handler you created.
Application Implementation
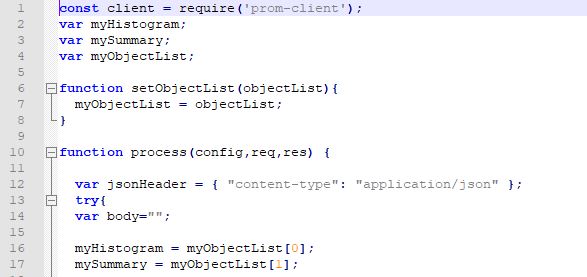
To focus back to our topic today, I am going to cover the code to be included in threadfin-http application to allow my application to feed metrics back to Prometheus. First of all, what we need is to import prom-client library into the threadfin-http application. This can be easily done by running “npm install prom-client” in our Node.JS project. Following the code snippet I shared below, you need to then import prom-client to app.js which the main js file used by threadfin-http.

In prom-client, there are several metrics you can collect from your Node.JS application. You can use DefaultMetrics (Line 6-7) to collect heap memory and CPU utilization from the Node.Js process. In addition, we can add a Prometheus Histogram (Line 9-15) and Prometheus Summary (Line 17-21) to collect statistic for the response time and count of the API requests.
Line 6-21 talked about how to object initialization. After these objects are initiated, we need to invoke “passing_object” method in threadfin-http engine to pass Histogram and Summary objects (Line 27) to the corresponding request handler which is used to handle the API implementation.
In this example, I have created a simple calculator which has a Calculate API (calculate_handler.js) to do summation based on the inputs.
Code Snippet – calculate_handler.js – Part 1
In Calculate Request Handler, you need to create a setObjectList method; which will be used by threadfin-http engine to pass object list (Line 6-8) from app.js to requesthandler.js. After these objects are set to variable in request handler, you can use the startTimer() method (Line 16-21) from Histogram and Summary object to track the API response time and API count and then register these statistic in Histogram and Summary objects. Method end() will need to be invoked at the end of the implementation to harvest the statistic. If you are interested to track the request count based on status code, you will then need to include method and status_code in the end method. (Line 34, 39-40, 44-45).

Code Snippet – calculate_handler.js – Part 2
So far so good? Finally, a new request handler called metrics_handler.js (please see below) will also need to be added to feed the collected metric to Prometheus. This API will be invoked by Prometheus to regularly retrieves statistic collected from application.

Code Snippet – metrics_handler.js
Prometheus Configuration
From an application perspective, this is basically what you need to enable application monitoring for your Node.JS application. To feedback statistic to Prometheus, scheduled jobs need to be configured at Prometheus to regular call API to retrieve statistics from various application. Target need to be setup at prometheus.yml by specifying the URL of the metrics end points.
To achieve this, I have created a target called “threadfin-log” and specify the end point of the threadfin-http applications deployed to my 2 docker swarm nodes. (please see below). In addition, I have also configure “docker2 end point to collect statistic from Docker Daemon and Docker Swarm.
Screenshot of Prometheus Target
To accurately collect statistic from the 2 Node.JS application nodes, Prometheus need to communicate to the docker swarm nodes through Docker internal IP addresses. This is important as docker swarm has an inbuilt load balancer to front the client request. (please see below) Typically, client request will be route to any of the node through round robin when you accessing the application through host IP address. Regardless which host you are hitting, request can be processed by container deployed in either Node. If we are using Prometheus to retrieve application metric by calling <host ip address>/metrics, it will result to request randomly route to any of the node. Your statistic will not be correctly reflected.
Connecting through internet IP addresses will solve the problem by avoiding Prometheus to going through the docker swarm load balancer. To achieve this, we need to create an overlay network in docker swarm to connect containers across 2 nodes. In the below diagram, the 2 threadfin-log containers and prometheus are all attached to a single overlay network. Prometheus will invoke metric api through the internal IP addresses.
 Docker Swarm Architecture
Grafana Dashboard Visualization
The Prometheus setup is pretty straightforwad. Once this is completed, you can now connect grafana with Prometheus by using Prometheus as Data Source.

Data Source Configuration
With the Data Source, Grafana Dashboard can be created to start monitor the application through statistic collected by Prometheus. In the below example, I have collected the API Response Time and API request count through Summary (threadfin:api_calculate_avg_response) and Histogram (threadfin:api_calculate_duration_count).

Application Dashboard
For docker cluster monitoring, you can also connect to node.js & docker swarm to pull out information such as Memory Utilizatio, Cluster Node Status & Container Status to start monitor number of container and nodes running in your docker swarm cluster.

Screenshot of Cluster Dashboard
That’s all you need to do run Node.JS application in docker and start having useful metric available in grafana for monitoring purposes. There are much more metric you can use to enhance your dashboard. I hope this article is useful for you to kick start your micro services journey with Node.JS and Prometheus!
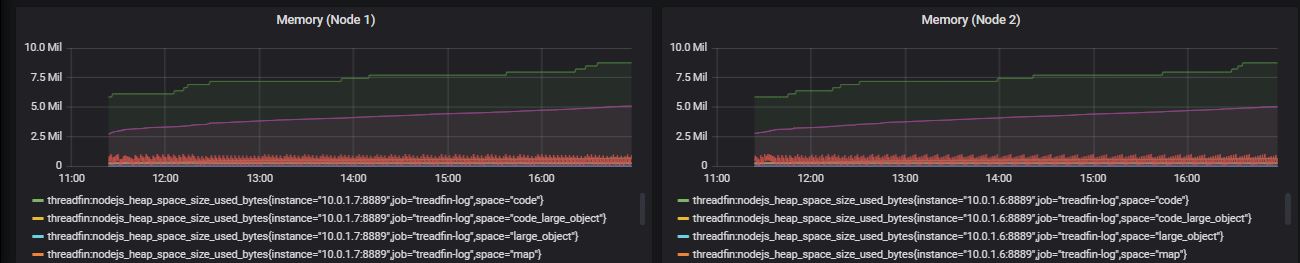
Node.Js Memory Utilization


Comments
Post a Comment